Glossary · Essay
xT: Not Every Pass Forward Is Progress. Here's What Actually Threatens a Defense
Distance up the pitch isn't the same as danger created. Expected threat values every pass and carry by how much it actually raises the chance of a goal.

By 01 Owen
· Updated 6 Oct 2026 · 5 min read
A sideways pass fifteen yards inside the opposition half can be worth more than a long ball that travels forty yards forward, and expected threat is the metric built to explain why. Most fans, watching live, judge progress by distance: the further a pass or a run advances the ball, the better it looks. xT judges progress by danger instead, and the two don't always agree.
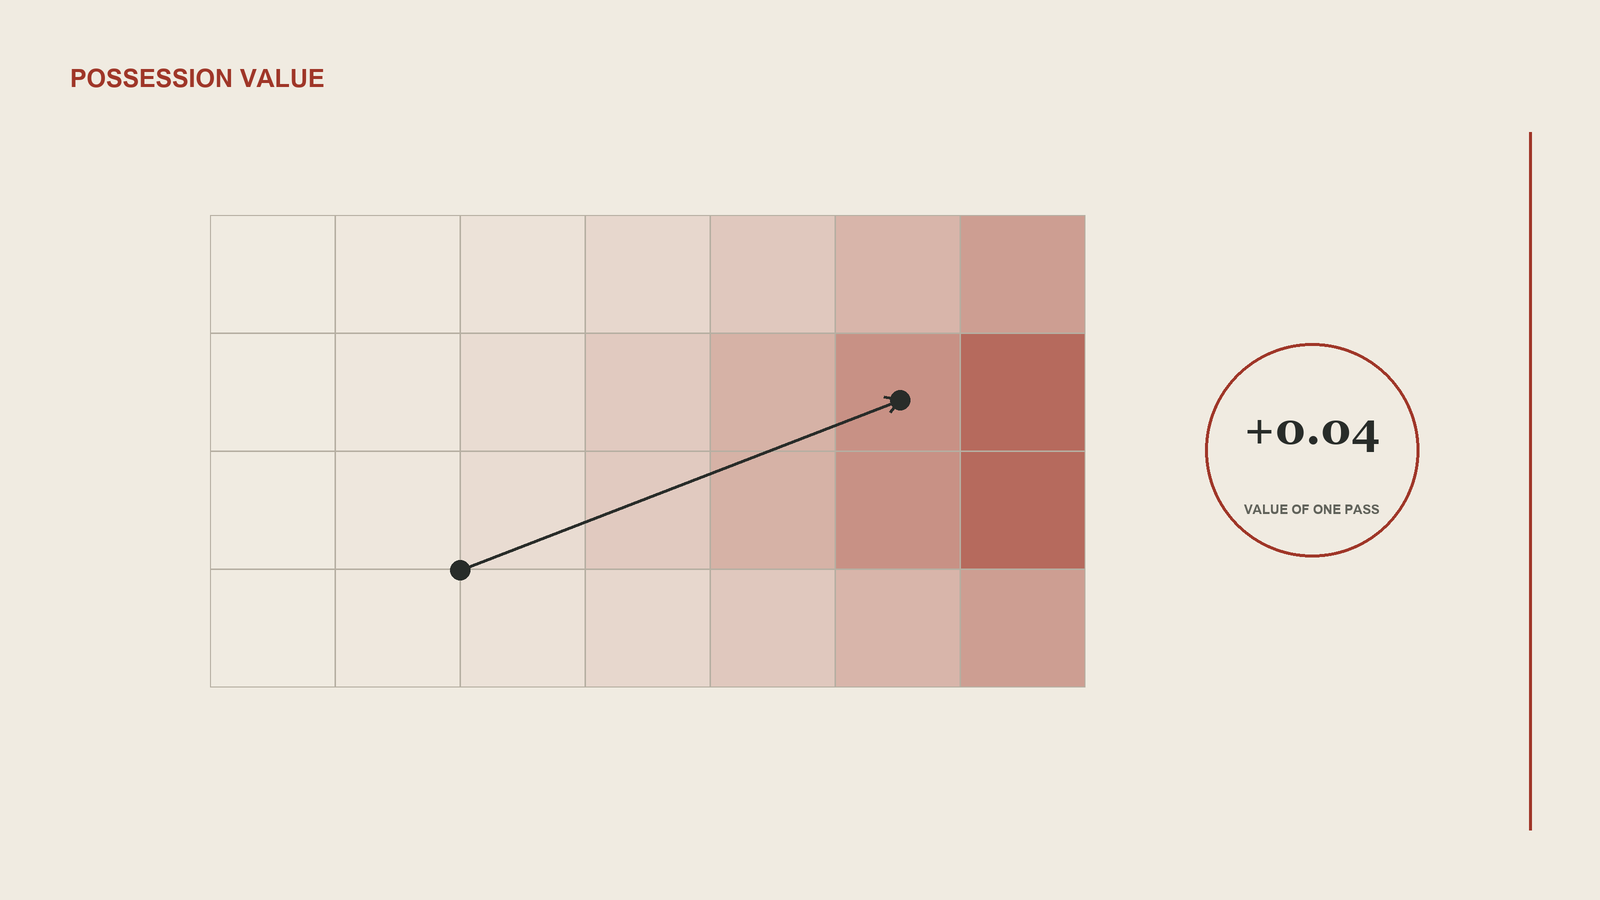
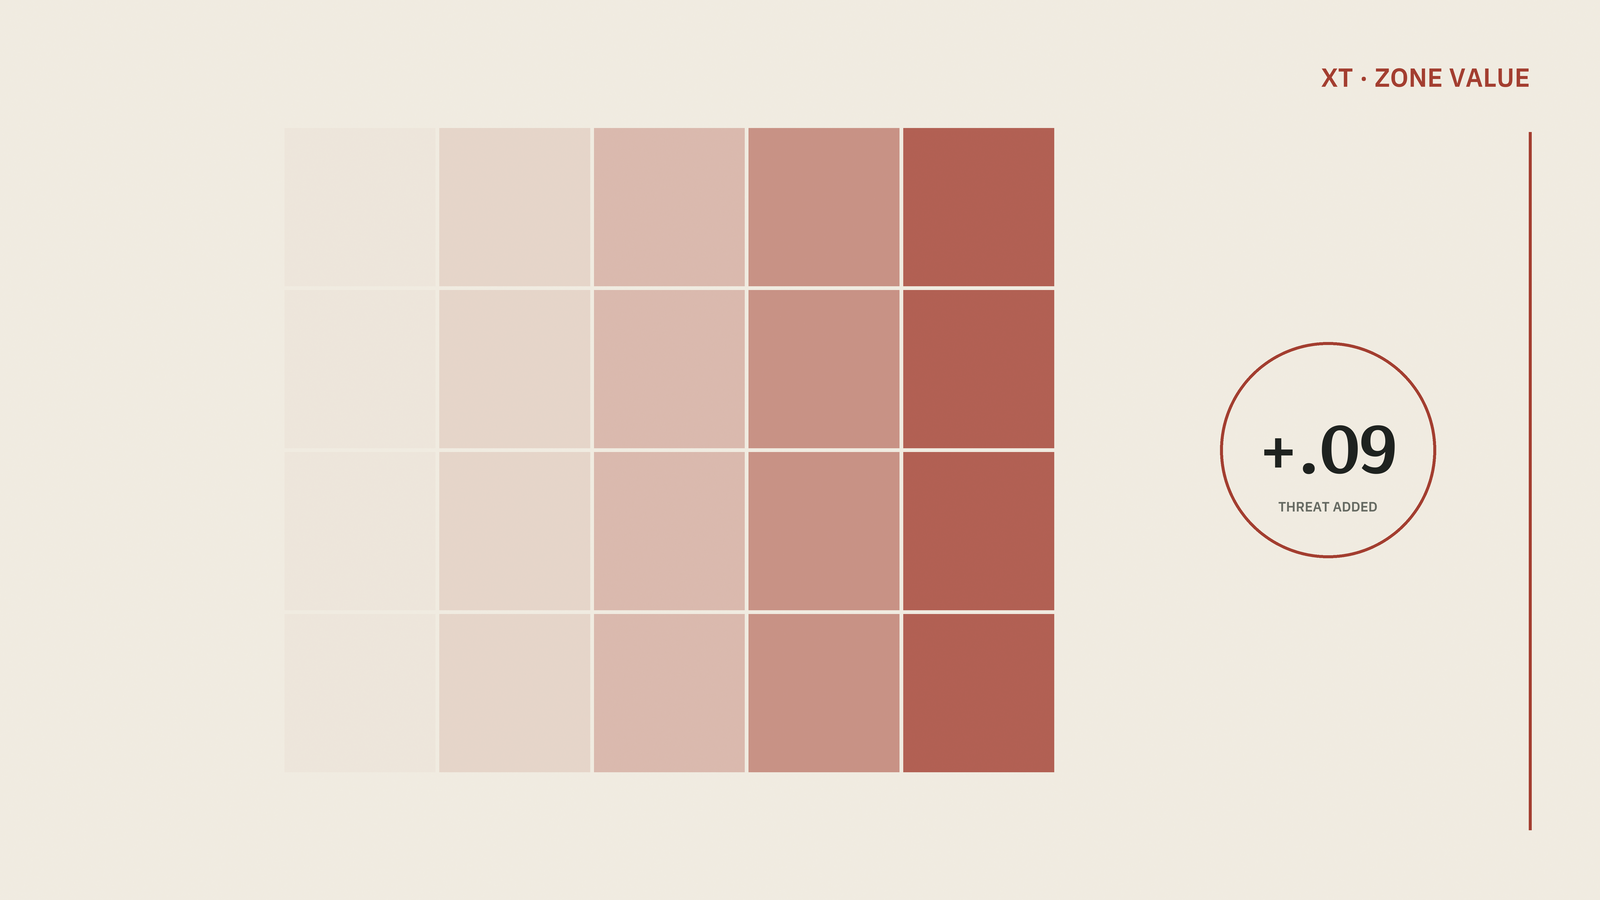
The model divides the pitch into a grid, usually something like twelve zones wide by sixteen deep, and assigns every zone a value based on how likely a possession starting there is to end in a goal, calculated from a huge sample of historical possessions. A zone just outside the six-yard box carries a high value because possessions that reach it convert into goals often. A zone near your own corner flag carries almost none. Every time a player passes or carries the ball from one zone to another, xT credits them with the difference between the two zones' values. Move the ball from a low-value zone to a high-value one and you earn threat. Move it sideways between two similarly dangerous zones and you earn very little, even if the pass looked incisive.
xT versus progressive passing
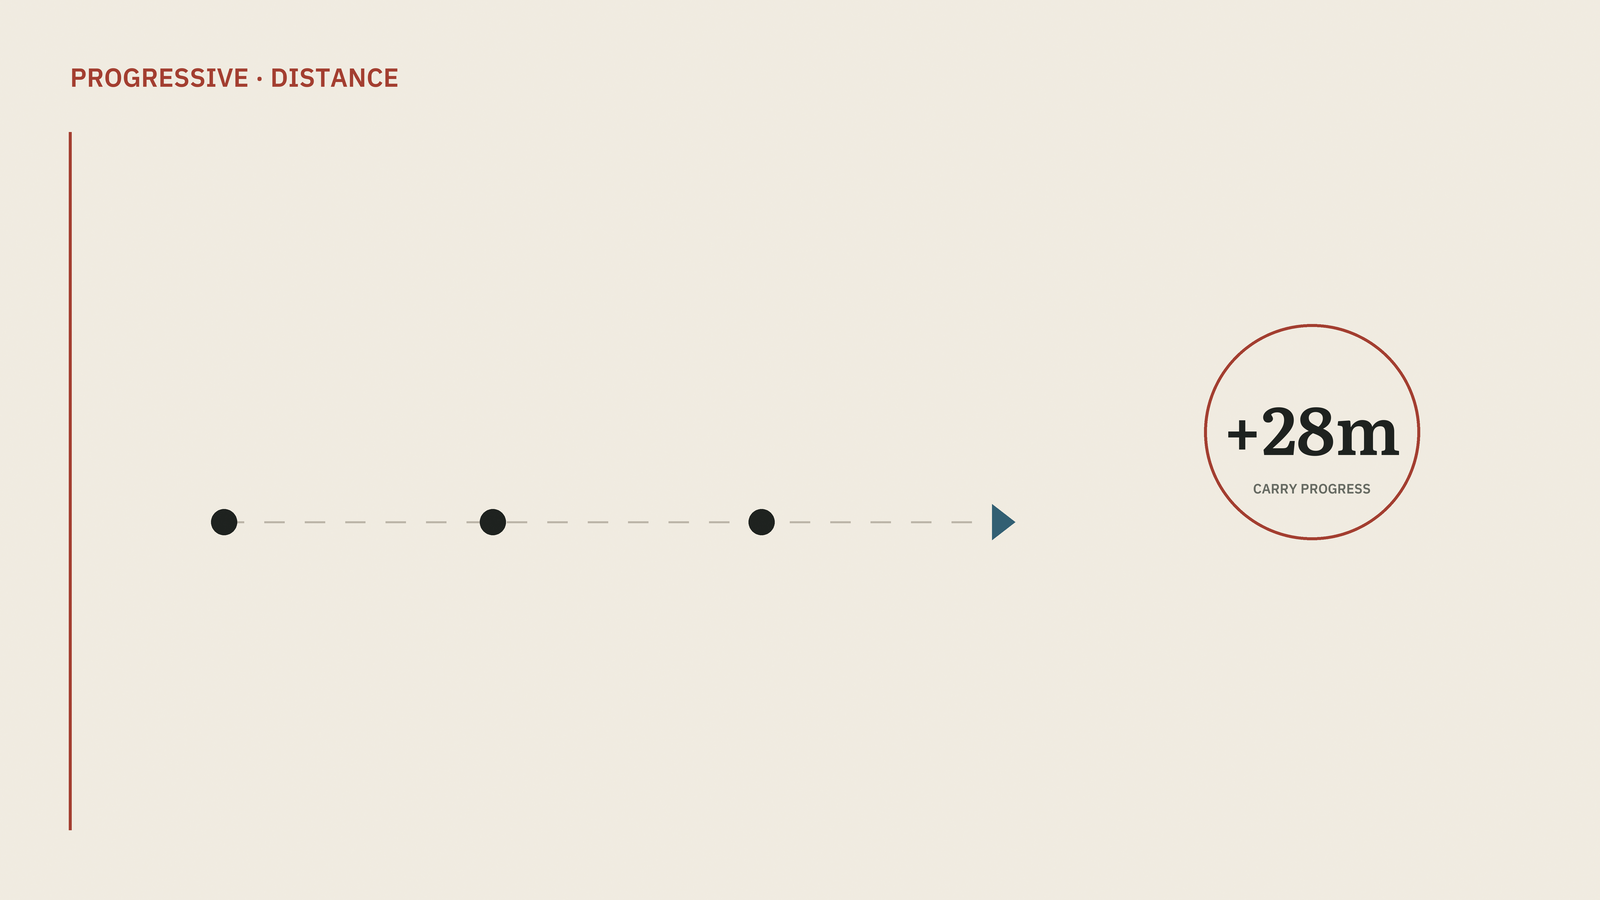
This is what separates xT from a simple progressive-passing count. A pass from the center circle out to a fullback thirty yards up the touchline covers a lot of distance, but the touchline thirty yards out isn't an especially threatening zone to receive the ball in, so the xT value is modest. A five-yard pass that finds a midfielder turning into the space between the opposition's center backs and defensive midfielder, the pocket between the lines, often reached through the half-space, can be worth several times more, because that zone converts into shots far more often. Distance is what the eye tracks. Zone value is what the model tracks, and it's usually the better proxy for danger.
Credit for carries
Carries count the same way passes do, which matters for players whose main contribution is running with the ball rather than distributing it. A dribbler who beats a defender and drives from midfield into the box accumulates xT the same way a passer does moving the ball through the same zones. That's part of why the stat has become popular for evaluating wingers and ball-carrying midfielders whose value doesn't show up cleanly in assist or goal counts. It captures the value of the buildup that made a later chance possible, not just the final pass before the shot.
Where the model falls short
The model has real limits. It only knows the zone the ball started and ended in, not what happened in between, so a risky pass through three defenders and a safe pass into open space get credited identically if they cover the same zones. It also treats every team's grid values as roughly universal, when in practice a low block defends the danger zones differently than a high line does, and the actual probability of a possession converting from a given zone shifts depending on who's defending it. Public models generally don't adjust for that opponent-specific context.
What xT makes visible
What xT is good at is making visible a kind of contribution that raw passing stats miss entirely: the pass before the assist, the carry that dragged a defender out of position, the switch of play that didn't lead to a shot this time but reliably does over a season. It rewards positioning the ball dangerously, which is most of what good buildup play actually is, even when the scoresheet has nothing to show for it.
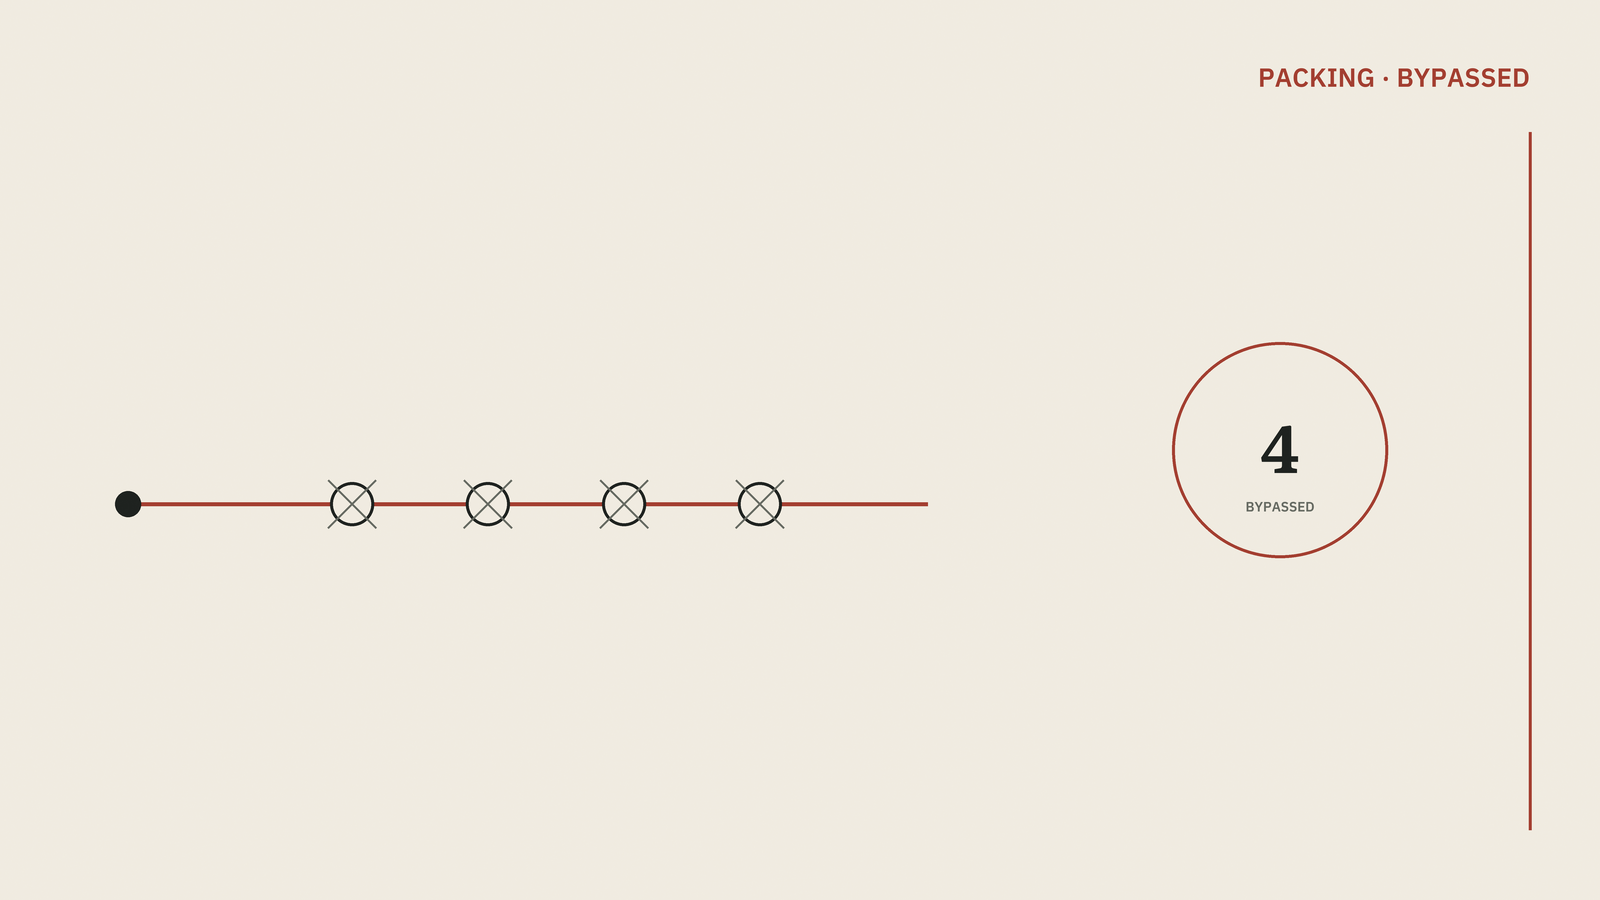
It pairs naturally with a simpler count of progressive passes and carries, which tracks the same forward movement without weighing how dangerous each zone actually is, and with verticality, which measures how directly rather than how dangerously that movement covers ground.
xT is one member of a wider family. The article on possession value sets it beside OBV and VAEP, which value the same actions with different models.
Can xT be negative?
A single action's xT contribution can't go below zero in most public implementations, since it's built from the positive difference between a destination zone's value and an origin zone's value, but a pass or carry that moves the ball into a less dangerous zone simply earns close to nothing rather than a negative score. Some private, more detailed models do allow negative values to penalize genuinely regressive actions, like a pass that retreats the ball into a team's own defensive third under no pressure, but the standard public zone-based version most fans encounter effectively floors at zero.
How is xT calculated?
Expected threat, or xT, divides the pitch into a grid, usually around twelve zones wide by sixteen deep, and gives each zone a value based on how likely a possession there is to end in a goal. Each pass or carry is credited with the difference between the values of the destination zone and the starting zone.
Why can a short pass earn more xT than a long one?
xT judges progress by danger, not distance. A pass from the centre circle to a full-back thirty yards up the touchline covers ground but lands in a modest zone. A five-yard pass that finds a midfielder turning into the pocket between centre-backs and defensive midfielder can be worth several times more, because that zone converts into shots far more often.
What are the limitations of xT?
xT only knows where the ball started and ended, so a risky pass through three defenders and a safe pass into space earn the same if they cover the same zones. It also treats grid values as roughly universal, although a low block defends danger zones differently from a high line. Public models generally do not adjust for that opponent context.
Sources and further reading
- Introducing Expected Threat (xT) — Karun Singh (accessed 18 Sep 2026)
- Opta Football Stats Definitions — Opta Analyst (accessed 18 Sep 2026)