Glossary · Analysis
Goals and Assists Credit Two Touches a Move. Possession Value Models Rate the Rest
Possession value models such as xT, VAEP and OBV put a goal-probability value on every pass, carry and tackle, not just shots. How they differ and where they break down.

By 01 Owen
· Updated 19 Sep 2026 · 5 min read
A possession value model is any model that puts a goal-probability value on every on-ball action, not just the shot, by asking how much that action changed the team's chance of scoring or conceding. Expected threat, VAEP and On-Ball Value are the three names most readers will meet, and they are members of one family rather than competing ideas. Each starts from the same complaint about the scoresheet: goals and assists credit the last two touches of a move and ignore everything that made those touches possible. KU Leuven's VAEP page puts it bluntly: a match contains roughly 1,600 on-the-ball actions, and traditional statistics reward about one percent of them.
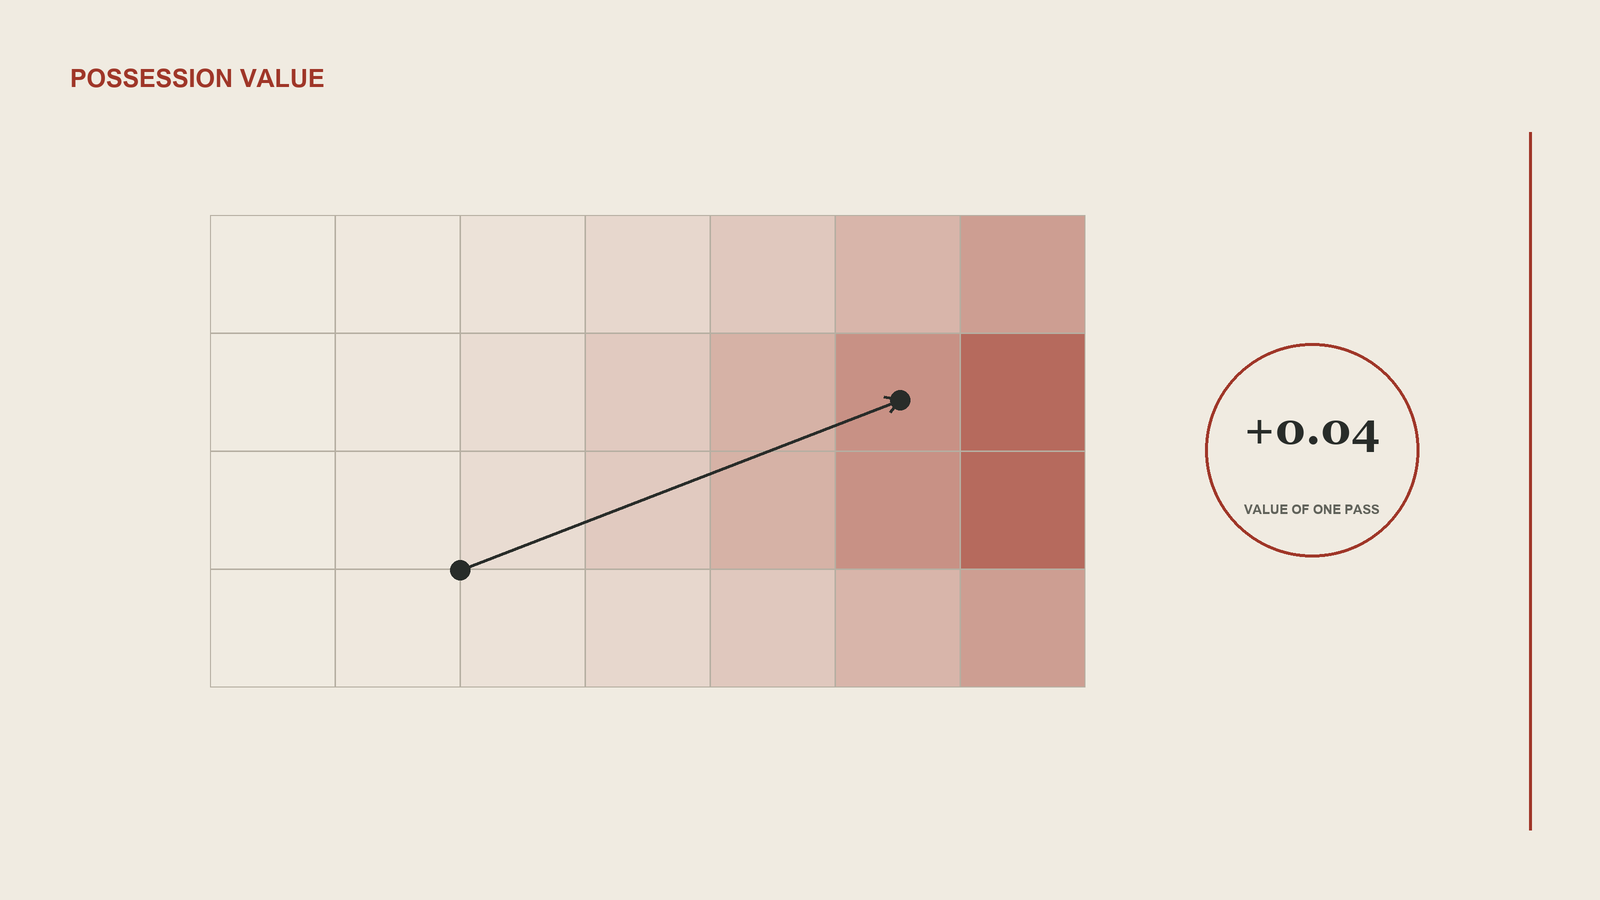
The shared mechanism is simple to state. Take the game state before an action and the game state after it. Estimate how likely the team in possession is to score in the near future from each. The difference is the value of the action. A pass that moves the ball from a harmless position to a dangerous one earns a positive number. A pass that gives the ball away in a bad spot earns a negative one. Expected goals already does this for shots, and xA extends it one step back to the pass that created the shot. Possession value models extend it to the whole possession, and in the more complete versions to the defensive actions that end one.
Expected threat is the simplest member of the family. It divides the pitch into a grid, values each zone by how often possessions that reach it go on to produce a goal, and credits a pass or carry with the difference between the destination zone and the origin zone. Karun Singh's original 2018 post used a 16 by 12 grid. The appeal is that it needs only ball location, so it runs on the most basic event data, and it is transparent: you can print the grid and read the values. The cost is that it knows nothing about the pass itself, the defenders around it, or whether the team is now exposed to a counter.
VAEP, short for Valuing Actions by Estimating Probabilities, was built by Tom Decroos and colleagues at KU Leuven and takes the event-based route instead. Rather than a grid, a machine learning model reads features of the last few actions (type, location, outcome, timing) and estimates two probabilities for the team in possession: scoring in the next handful of actions, and conceding. An action's value is the change in scoring probability minus the change in conceding probability. That second term is what makes VAEP two-directional. A defender's interception earns credit because it lowered the chance of conceding. A risky forward pass that leaves the team open can score lower than its distance up the pitch would suggest. It needs full event data with action types and outcomes, and the implementation is open source through the socceraction library.
On-Ball Value is StatsBomb's version, launched in September 2021. It shares VAEP's logic of valuing both directions, but it reports goals for and goals against as separate components rather than a single net figure, and it measures the change in expected goal difference across the current possession and the next one. Two design choices set it apart. It is trained on StatsBomb's own expected goals rather than on actual goals, which the launch article argues reduces noise, and it credits nearly every action type: passes, carries, dribbles, clearances, blocks, and goalkeeper saves and distribution. It is proprietary, and it relies on StatsBomb's richer event feed.
What all three are for is player valuation beyond goals and assists. A ball-carrying midfielder who never registers an assist, a centre back whose long diagonals start attacks, a goalkeeper whose distribution launches counters: all produce value the scoresheet misses and these models catch. Analysts sum a player's action values over a season, express them per 90 minutes, and split them by action type to build a profile. Compare this with packing, which counts the defenders a pass bypasses but never converts that into a goal probability. Possession value is the step from "how many defenders did this pass beat" to "how much closer to a goal did it bring us".
The models do not always agree, and the disagreements are instructive. In a published comparison of xT and VAEP, the KU Leuven group showed that a short dribble inside the penalty box that stays within one grid zone earns zero xT, because the zone value has not changed, while VAEP credits it because the game state improved. A pass that recovers possession on a counter-attack is rated far higher by VAEP, which knows the recent context. Run over a full season, the two models produced different top-player lists, with xT leaning towards creative playmakers and VAEP towards goalscorers.
The limits are real. Off-ball movement is invisible: the run that dragged a defender out of position and opened the passing lane earns nothing, and the passer collects all of it. Different training data, different lookahead windows and different feature sets mean two providers will rank the same player differently, and neither is wrong. Context is thin: most public models do not know the score, the minute, the opposition's quality, or whether a low block or a high line was defending the zone. And the per-action numbers are tiny, so a season total amounts to a few goals' worth of value, which is a noisy basis for a transfer decision. Treat the output as a lens on contribution, not a verdict.
What is the difference between xT and VAEP?
xT values only where the ball is. It reads the pitch as a grid, credits an action with the difference between two zone values, and ignores the type of action, the events before it and any defensive risk. VAEP values the whole game state. It uses the last few actions as input, estimates scoring and conceding probabilities separately, and rewards defensive actions as well as attacking ones. In practice, xT is easier to compute, easier to explain and available on basic data, while VAEP is more complete and more context-aware but harder to interpret. Both produce plausible rankings, and they disagree most on backward passes, counter-attack recoveries and short movements inside the box.
Sources and further reading
- Introducing On-Ball Value (OBV) — Hudl Statsbomb (accessed 18 Sep 2026)
- Actions Speak Louder Than Goals: Valuing Player Actions in Soccer — Decroos, Bransen, Van Haaren and Davis, arXiv (accessed 18 Sep 2026)
- Introducing Expected Threat (xT) — Karun Singh (accessed 18 Sep 2026)