Glossary · Analysis
Shot Quality: Why the Average Chance Matters as Much as the Total
Shot quality is total xG divided by shots: the average chance a team creates or allows. Why volume and quality are separate levers, and where the number breaks down.

By 01 Owen
· Updated 19 Sep 2026 · 5 min read
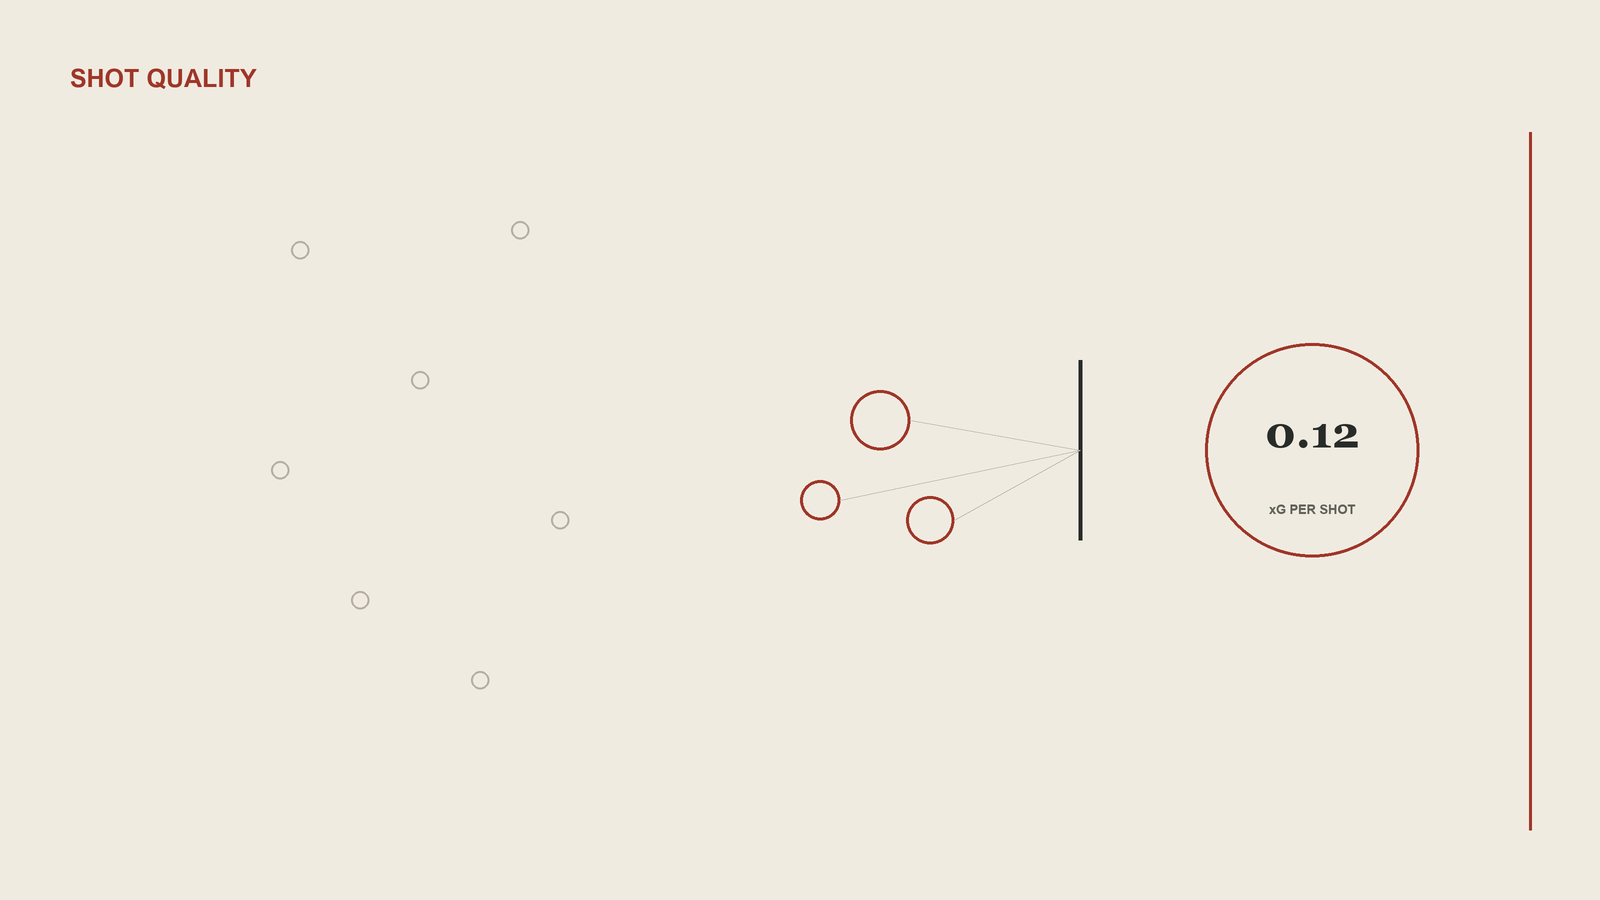
Shot quality is the average expected goals value of a shot: total xG divided by the number of shots taken, which gives the typical quality of chance a team creates or allows rather than how many chances it takes. Two teams can finish a match on the same xG total by completely different routes. One has thirty attempts worth 0.06 each, most of them from outside the box. The other works five clear chances worth 0.36 each. Both add up to 1.8 xG, and only xG per shot separates them.
That separation matters because volume and quality are different levers, and a coach can pull them independently. Volume comes from territory and tempo: winning the ball high, recycling possession into the final third, shooting early and often. Quality comes from patience and precision: refusing the half-chance from 25 yards, playing the extra pass to get a cutback rather than a cross, working the ball to a player in the six-yard box. A side that presses aggressively and shoots on sight will tend to pile up attempts at a low average value. A side that circulates the ball until the defence opens will attempt fewer shots at a higher one. Neither approach is wrong. They are simply different ways of arriving at a similar xG total, and xG per shot tells you which one a team is using.
Ted Knutson's early StatsBomb work on shot quality gives a sense of the scale. A long-range effort carries roughly 0.03 xG, about one goal per 33 attempts. A shot from around the edge of the penalty area sits near 0.11. A pass that creates a one-on-one produces a chance worth at least 0.40. The gap between the first and the last is more than thirteen to one, which is why a team's shot selection can move its xG per shot a long way without any change to its shot count.
For teams, the number is a diagnostic. If a side is producing plenty of xG on very few shots, its build-up is working but it may be one blocked cutback away from a blank. If it is producing similar xG on many shots, its attack is sustainable in a different way but leaks value on every speculative effort. The Football Analyst puts a strong benchmark at 12 to 16 shots per game with an xG of 1.8 or more, which implies an average a little above 0.11 per attempt. Defensively it works in reverse. A team that concedes a lot of shots at 0.05 apiece is probably keeping opponents outside the box and can live with the volume. A team that concedes few shots at 0.20 apiece is being cut open, however tidy the shot count looks.
For strikers, xG per shot is close to a description of decision-making. Hudl Statsbomb's own guidance says that looking at average shot quality can highlight players taking good or bad shots, and that what separates good forwards is less above-average finishing than generating shots from valuable locations. A forward averaging 0.20 per attempt is getting into the six-yard box and waiting for the cutback. A forward averaging 0.07 is shooting from range and hoping. Both might score twelve goals in a season, but the first is doing it from a repeatable process and the second from a hot streak that will eventually cool.
Two adjustments make the number more useful. Penalties are worth about 0.76 xG each, so a single spot kick can lift a small sample's average dramatically, and analysts therefore quote non-penalty xG per shot for players and teams alike. And because pre-shot xG describes only the chance, not the strike, PSxG per shot adds a second layer: a player whose post-shot value per attempt runs well above his pre-shot value is choosing ordinary chances and hitting them better than average. If you want to see how distance, angle and body part change a single shot's value, try the xG calculator and move the shot around the box.
The limits are the usual ones. Because it is a ratio, xG per shot is far noisier than total xG on small samples; five shots can produce almost any average, and a single penalty or tap-in can swing a match figure by a tenth. Different providers build different models, so a team's xG per shot on one site will not match another's, and comparing across sites is meaningless. And the number says nothing about whether shots should have been taken at all. A team that refuses every half-chance will post a flattering average and a disappointing total. Read it alongside shot count and total xG, never instead of them.
What matters more, shot quality or shot volume?
Over a season, total xG matters most, and both levers feed it. But at the same total, quality has an edge. Knutson's simulation of a team taking a few high-value chances against one taking many low-value ones found that the high-quality side collected two to three extra points a season, simply because its scoring output varied less from match to match. Elite opponents also make volume hard to come by, which is why the best sides tend to combine a steady 12 to 16 attempts with a high average value rather than choosing one extreme. A team that lacks volume cannot rely on quality alone across 38 games. A team that lacks quality is a hostage to variance.
Sources and further reading
- Shot Quality vs. Shot Volume: What Matters More? — The Football Analyst (accessed 18 Sep 2026)
- Explaining and Training Shot Quality — StatsBomb (accessed 18 Sep 2026)
- Expected Goals (xG) Explained — Hudl Statsbomb (accessed 18 Sep 2026)